

Request information from Platform Science about
Fleet Management Optimization
by
Link-X Fleet Solutions


Link-X integrates seamlessly with Platform Science to turn data into dollars. Cost-per-mile, TCO, and utilization analytics unify across every unit, while AI flags spend anomalies and model asset replacement — fleets achieve measurable savings within their first 90 days.



Most fleets are data-rich and decision-poor. Telematics lives in one system, maintenance history in another, fuel and invoices somewhere else entirely — and by the time anyone assembles a report, the moment to act on it has passed. Link-X integrates seamlessly with Platform Science to turn every mile of telematics data into measurable savings.
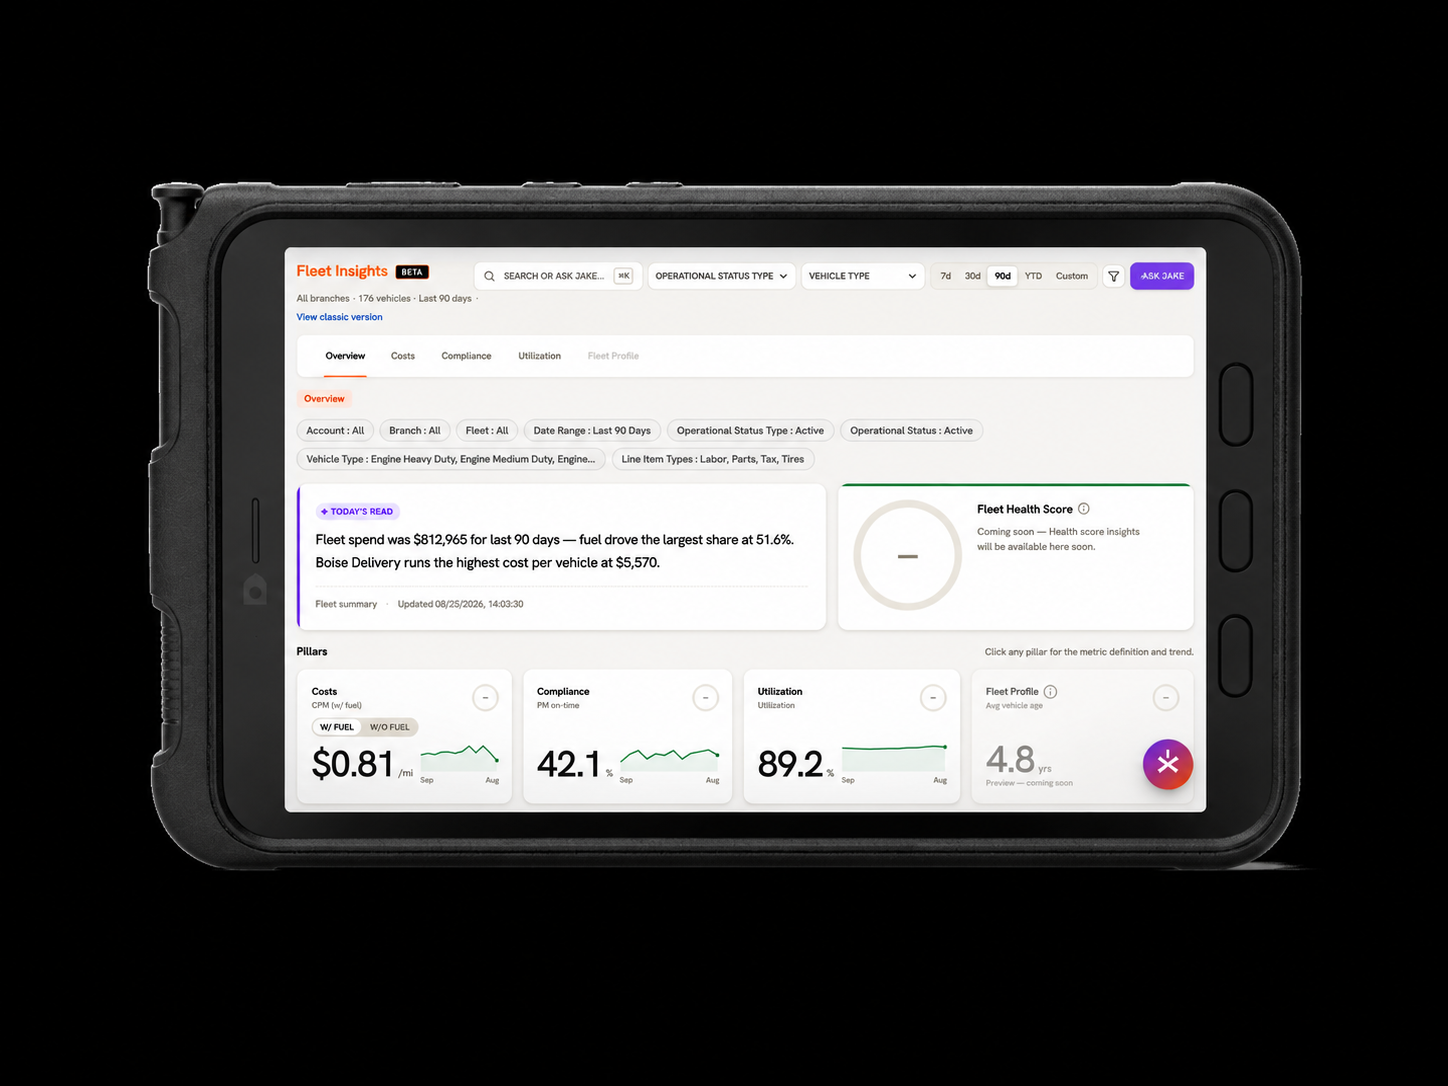
Link-X unifies vehicle, maintenance, fuel, and invoice data into a single analytics layer built specifically for fleet economics. Track true cost-per-mile and total cost of ownership down to the individual unit, monitor utilization to expose assets that aren't earning their keep, and let AI-driven anomaly detection flag abnormal spend before it compounds into a five-figure repair. Replacement modeling answers the question every fleet argues about: which trucks to run, which to repair, and which to retire — and what each decision is worth.
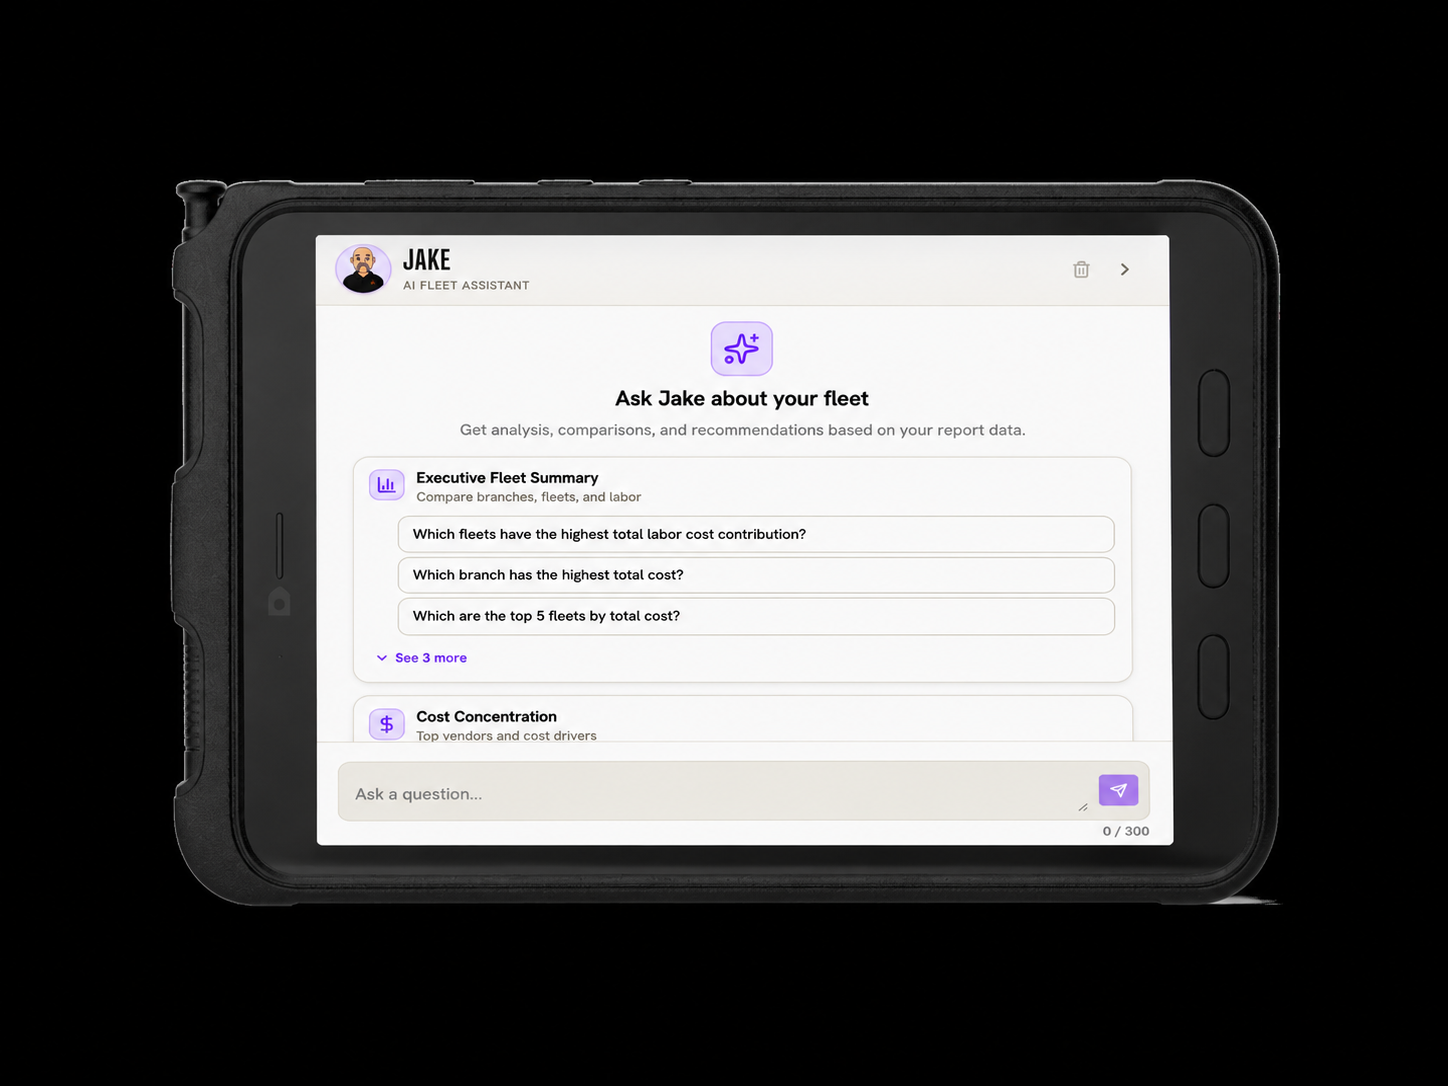
The output is board-grade. Dashboards and reports are built to be presented, not reverse-engineered, so fleet leaders walk into budget conversations with numbers sourced from their own operating data rather than estimates. Ask Jake, the Link-X AI analyst, a question in plain language — why maintenance spend jumped last quarter, whether to lease or buy, when a given unit crosses the line from asset to liability — and get an answer traced back to the underlying records. Fleets realize measurable savings within their first 90 days! And because Link-X reads the data your trucks are already generating through Platform Science, there is nothing new to install in the cab.
● True Cost to operate by unit — Cost per mile (or hour) calculated from actual maintenance, fuel, parts, and labor data, not fleet-wide averages
● Cost category breakdown — See what's driving Costs — tires, PM, unscheduled repair, fuel — and where it's trending
● Invoice and vendor analysis — Spend by shop and vendor with pricing outliers surfaced against your own history
● Inspection performance analytics — Pass and fail rates, violation trends, and OOS events by unit, driver, and terminal
● PM compliance rate — On-time versus overdue preventive maintenance across the fleet, trended over time
● Audit-ready reporting — Complete, sourced records assembled for DOT audits and internal review
● Underutilized asset identification — Surface units that aren't earning their keep before you buy another one
● Right-sizing analysis — Fleet composition modeling to show how many units you actually need, and of what type
● Downtime tracking — Out-of-service time by unit and cause, measured against utilization targets
● Total cost of ownership modeling — Full lifecycle cost per asset from acquisition through disposal, including depreciation and downtime
● Run, repair, or retire recommendations — Data-backed disposition guidance for every asset in the fleet
● Lease vs. buy analysis — Acquisition scenario modeling built on your own cost history
● Jake AI Analyst — Ask questions in plain language and get answers traced back to source records
● Unified data layer — Telematics, maintenance, fuel card, parts, and invoice data consolidated into one source of truth
● Board-grade dashboards — Presentation-ready executive views alongside operational detail for fleet managers
● True CPM or CPH by unit — Averages hide the outliers. Find the units destroying your margin and fix, reassign, or retire them.
● Cost category breakdown — Know what to fix, not just that something's wrong. Catch a category creeping up early.
● Invoice and vendor analysis — Stop paying three prices for the same repair. Recover excess repair spend.
● Inspection performance analytics — Violations cluster. Fix the source, not the fine & avoid OOS.
● PM compliance rate — Deferred PM becomes failure at 3-5x the cost. Make discipline a number.
● Audit-ready reporting — Run the audit report instead of building it.
● Underutilized asset identification — Redeploy instead of buy or shed excess fixed costs.
● Right-sizing analysis — Stop paying to own capacity nobody dispatches, and spec the next buy to real demand.
● Downtime tracking — Maximize earnings per fleet assets. Minimize downtime and maximize revenue.
● Total cost of ownership modeling — Buy on lifetime cost, not sticker price. Purchase price is the smallest part of the bill.
● Run, repair, or retire recommendations — Ends the argument. Don’t wait for the P&L to tell you an asset was held too long.
● Lease vs. buy analysis — Your numbers, not the vendor's — gain the leverage in your next negotiation.
● Jake AI Analyst — Answers in seconds, not days. Make quicker, more strategic decisions.
● Unified data layer — Kill the reconciliation work — and the argument over whose number is right.
● Board-grade dashboards — Win the budget conversation with hard numbers, not a spreadsheet nobody trusts.


